
Introduction
This blog post is the third in a four-part series about my work with energy social science data curation at the Carnegie Mellon University Libraries (University Libraries hereafter) and the Wilton E. Scott Institute for Energy Innovation (Scott Institute hereafter). In this post, I’ll describe my collaboration with Prof. Destenie Nock and her research team involving a project focused on energy poverty. This collaboration showcases some of the data service support provided by the University Libraries to advance research efforts that align with the United Nations Sustainable Development Goal 7 (Affordable and Clean Energy) and 10 (Reduced Inequalities).
Brief context of the research project
Let’s start with a simple relationship between two variables: household electricity consumption and outdoor temperature. We begin with the assumption of a baseload, the amount of electricity consumed that is not climate (temperature) dependent (e.g., cooking, hot water, and lighting). We further assume that as the temperature outdoors surpasses a threshold, households consume more electricity (beyond the baseload) to cool their homes. Similarly, when outdoor temperature drops below another threshold, households consume electricity beyond the baseload to heat their homes. Our first focus is on such threshold temperatures. To make it easier to understand these threshold temperatures, you can think of them as the temperatures you set on your thermostats.
Our core data modeling question is: Without asking households themselves or observing their thermostat settings directly, what are the threshold temperatures (we called these cooling or heating balance points) of a household determined by comparing its daily total electricity consumption to the daily average outdoor temperature? Once such balance points are estimated, our data analysis then focuses on whether different socio-demographic groups have different balance points, crucial to investigating energy limiting behavior (defined as the situation when certain households attempt to limit their energy consumption due to limited financial resources), an important dimension of energy poverty.
For this blogpost, I’m not going into the statistical details of the method we are using, but the general idea is to use regression analysis to estimate the balance points. If you’re interested, you can get a general sense of the methodology in this recently published article by Cong et al. (2022).
The data curation part of the work
To answer these research questions, the research team obtained a large electricity consumption dataset from a utility company. This dataset presented two major challenges: 1. The time span of the raw data lasts for more than two years, and not all months have the unique household IDs; 2. The raw data was compressed as two levels of zipped files that are tricky to unzip in bulk.
For the first challenge, I wrote a fairly straightforward Python script to find the common IDs for a given time span. In the following, I’ll talk more about how I tackled the second challenge in Python, because personally I think the specific data structure is quite uncommon.
A glimpse of the directory structure
To make the description easier, I list the directory structure of the raw data below (annotations in square brackets):
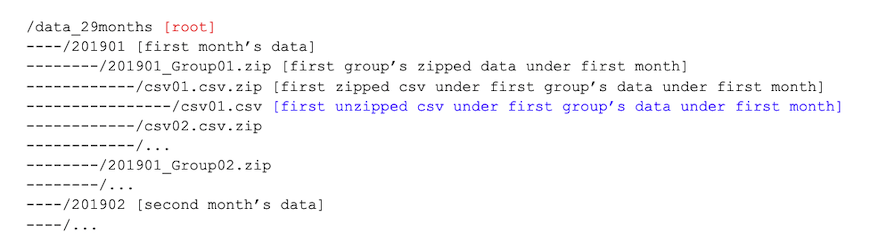
The raw dataset is organized by month. The monthly data are first organized into different groups and zipped; within each group are multiple zipped csv files; finally within the zipped csv files, there are the csvs files that can be read by pandas (a popular package to manage tabular data in Python). At a high level, the task is to start from the root (in red, above), retrieve the electricity consumption data stored in the csv files [in blue, above], and put the retrieved data in any preferred data structure (e.g., json).
The most important thing to consider here is that we don’t want to unzip and save any intermediate level of data on disks, because the dataset is very large and doing this will take up unnecessary disk space.
The Python code snippet to do the unzipping work
An example of Python 3 code used to unzip two consecutive levels of zipped data with a similar directory structure is:
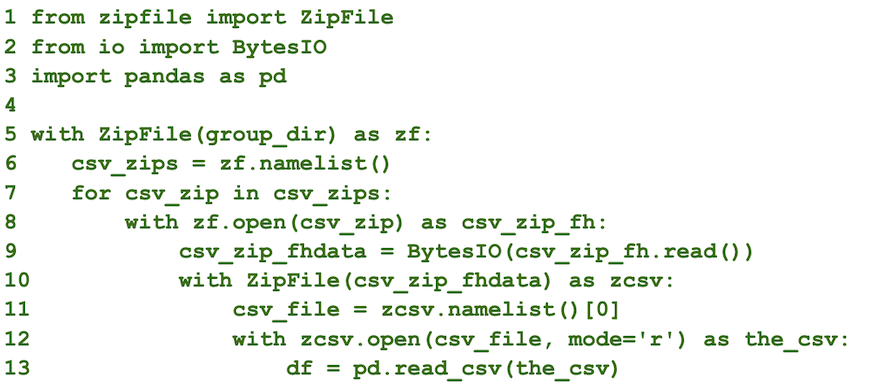
The snippet assumes that there is a path name for the first level zipped file (‘group_dir’; Line 5). The rest of the code will loop through each zipped csv file, unzip it, and read each unzipped csv file into a pandas dataframe.
I put together a minimal reproducible example to test out the code snippet available in this GitHub repository. This code is available for public use under the terms of the MIT license. Feel free to adapt the code to your needs.
Stay tuned to my last post. It will cover the takeaways from a research data management survey and interview series that I’ve been conducting among the CMU energy research community.
If you haven’t, check out my previous post on working with the Dimensions database and the post on the RICCH dashboard.
Acknowledgments
Many thanks to Destenie Nock and her research team for supporting my work. My fellowship has been supervised by Rikk Mulligan (Digital Scholarship Strategist, University Libraries) and Anna Siefken (Executive Director, Scott Institute). This fellowship is made possible in partnership with the Council on Library and Information Resources (CLIR), with the generous support of the Alfred P. Sloan Foundation.
References with links (by order of appearance)
- Pylon. Photo by Shane Rounce on Unsplash. Free to use under the Unsplash License, https://unsplash.com/photos/1ZZ96uESRJQ
- Wilton E. Scott Institute for Energy Innovation, https://www.cmu.edu/energy/
- UN Sustainable Development Goal 7, https://www.un.org/sustainabledevelopment/energy/
- UN Sustainable Development Goal 10, https://www.un.org/sustainabledevelopment/inequality/
- Cong, S., Nock, D., Qiu, Y.L. et al. Unveiling hidden energy poverty using the energy equity gap. Nat Commun 13, 2456 (2022). https://doi.org/10.1038/s41467-022-30146-5
- pandas dataframe, https://pandas.pydata.org/docs/reference/api/pandas.DataFrame.html
- Cmulib-blog3-code [GitHub repository], https://github.com/hluling/cmulib-blog3-code
- MIT license, https://github.com/hluling/cmulib-blog3-code/blob/master/LICENSE
- Council on Library and Information Resources, https://clir.org/
by Luling Huang, CLIR Postdoctoral Fellow in Data Curation for Energy Social Science