Introduction
This blog post kicks off a four-part series about my work with energy social science data curation at the Carnegie Mellon University Libraries (University Libraries hereafter) and the Wilton E. Scott Institute for Energy Innovation (Scott Institute hereafter). As part of my CLIR (Council on Library and Information Resources) postdoctoral fellowship, I have been working on a series of projects to help the University Libraries better understand and provide data support to the energy research community at Carnegie Mellon University (CMU). In each post of this series, I will focus on one of my fellowship projects.
In this post, I’ll describe how I’ve used a scholarly information database (Dimensions) to help the Scott Institute to more efficiently discover and track the research output of its faculty affiliates. The rest of the series will cover: (1) using R Shiny to create a dashboard for a project to visualize the effects of climate change on hydropower in the global south; (2) working with a research team to clean and analyze a large dataset of electricity consumption to study energy poverty and justice in the U.S.; (3) the takeaways from a research data management survey and interview series that I’ve been conducting among the CMU energy research community. I’m very excited to share my work with data and coding. If you find these topics interesting, keep reading and stay tuned to my future posts.
The Scott Institute’s Need: Who is Doing What?
There are over 160 faculty affiliates (including faculty fellows) associated with the Scott Institute. For the administrators of the Scott Institute, an important question is: “Who is doing what research now?” Discovering and verifying recent and current publications and grants is important for updating the expertise areas displayed on the Scott Institute’s website and in the annual IMPACT report, as well as for general planning and decision making.
Using a manual method, one can go through each expert individually to discover their latest publications, typically by keywords and abstracts to get a high-level understanding of the topics under study, and then synthesize this information with the current record. This procedure is tedious, painstaking, and doesn’t sound very exciting. Another route is to ask each expert directly, but this presents its own challenges in collating the information when it is eventually provided. So a solution was required to both quickly and accurately discover and track the research output of all affiliated energy experts.
Dimensions
Dimensions is a scholarly information database made available to the CMU community through the University Libraries. You can think of Dimensions as somewhat similar to Google Scholar. What makes Dimensions powerful and flexible to use is its Analytics API (available only by subscription at CMU). With the use of the Dimcli package in Python and the Dimensions Search Language (DSL), a variety of scholarly data (e.g., publications and grants) can be queried for a given list of researchers.
Concept and Concept Scores
Although much more efficient than copying and pasting from Google Scholar, using an API to batch-pull data is just the first step. The next problem is how to best make use of the data. The Scott Institute described a specific use case where the task is to find those experts who are doing research on a specific research topic (e.g., aluminum alloy). Again, Dimensions provides a useful feature to satisfy this need.
In the Dimensions database, for each publication or grant, there is a list of concepts extracted based on the discipline of the publication (or grant) and assigned a concept score by machine learning. Here, concept score is defined as the relevance of a given concept to the discipline of the publication (or grant).
Now, forget about the jargon. The bottom line is this: One can safely assume that if scholars do research on a certain topic, they are very likely to mention this topic in the publication or grant proposal. But what complicates this assumption is that, for example, aluminum alloy can be mentioned in a history paper and in a material science paper. The concept score helps distinguish between these two cases. Dimensions uses machine learning to decide, based on its large body of textual data, that aluminum alloy may tend to be more relevant to material science rather than history from a disciplinary perspective.
Applying the concept score to the dataset drawn by the API offers a reasonable workflow to be implemented as some kind of search tool. The goal was to search for a given term, find those publications or grants that include this term, then filter out publications or grants using a concept score threshold , and then return the list of experts listed as authors of the filtered publications or grants.
Communicating Results: Building an Interactive Dashboard
Once I had the initial ideas for filters and data visualization, I started to build an interactive dashboard, called Energy Expert Finder, using Dash in Python. The prototype of this Energy Expert Finder is provided in a screenshot below.
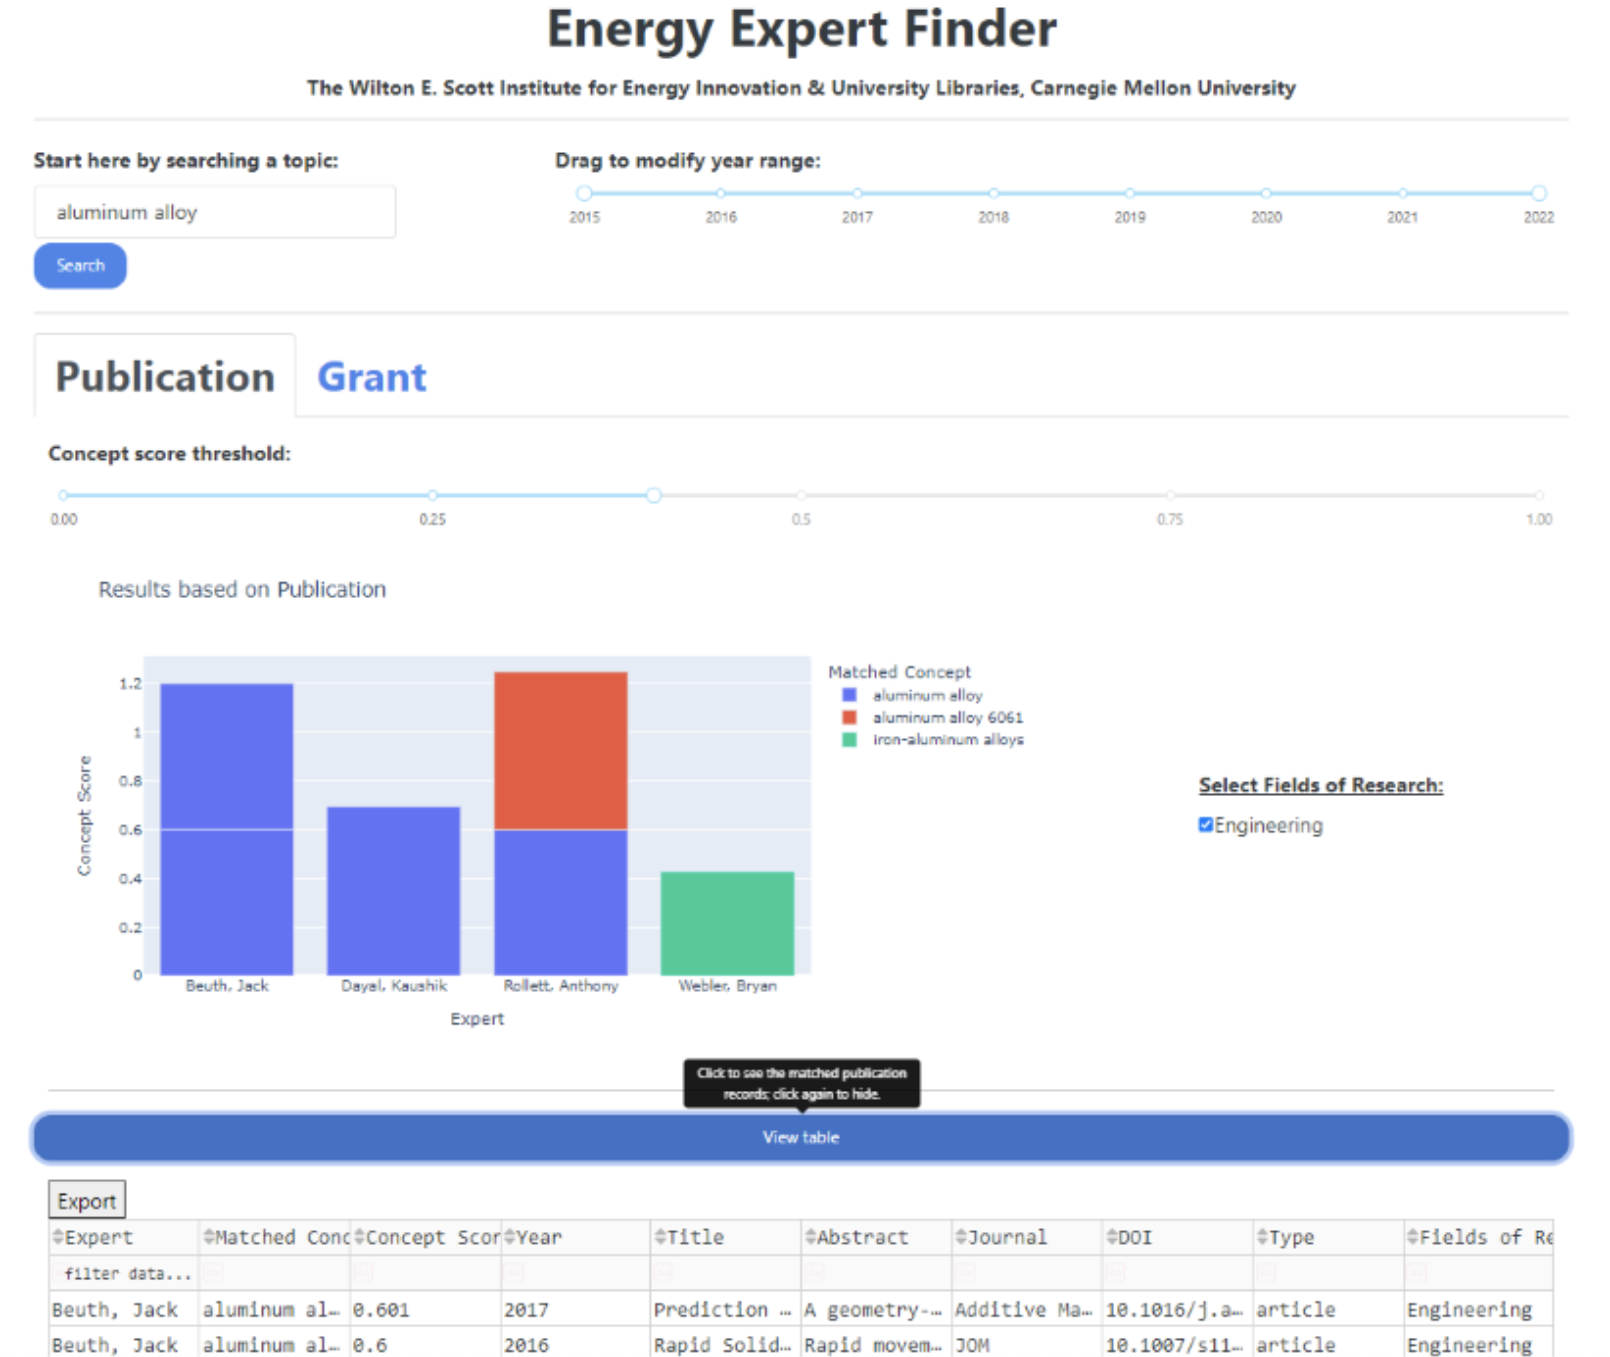
Users start by entering any research topic in the text box. Any concepts that contain the input text will be matched. Publications or grants that contain matched concepts and their authors will be returned. The associated concept scores (y-axis) will be plotted against expert names (x-axis) in a bar graph, so that users can see which experts focus more on some matched concepts than on others.
There are quite a few interactive features in this simple dashboard: (1) users can use a tab to switch between publication data and grant data; (2) there is a slider for selecting a range by publication date (in year) or grant date (in year); (3) the concept score threshold slider limits the results to the publications (or grants) with concepts that have equal or higher concept scores than the selected threshold; (4) users can interact with the bar graph using the standard features provided by plotly (e.g., hovering mouse over the bars to see the exact concept scores and selecting/deselecting the matched concepts in the legend); (5) users can use a checklist to select (or deselect) certain fields of research (one categorization system of academic disciplines used by Dimensions); (6) there is also a button to show or hide the returned publication or grant data. To keep the interface clean, the default is to hide the publication or grant data. However, if needed, users can choose to see more information about a publication or grant (e.g., abstract). Because this table is generated using a Dash DataTable, users can enter text to filter a column. Finally, the results can be downloaded (in CSV) using the “Export” button.
The dashboard is designed and available for internal CMU use only, because Dimensions is only available by subscription to CMU and using CMU credentials. If you’re affiliated with CMU and interested in playing with Energy Expert Finder, just send me an email: lulinghuang@cmu.edu.
Next Steps
The current prototype of Energy Expert Finder is undergoing user testing by Scott Institute personnel before being refined. I also hope to make the dashboard more friendly to mobile screens. Finally, and most importantly, if you want to have a discussion/collaboration with me on how to best use Dimensions with such a dashboard, email me at lulinghuang@cmu.edu.
Acknowledgments
Many thanks to David Scherer (Scholarly Communications and Research Curation Consultant, University Libraries) who provided Dimensions support at CMU, Jonathan Kiritharan (Web & Applications Developer, University Libraries) who provided data structure consultation and set up Energy Expert Finder on a University Libraries’s server, and Aiswariya Raja (former Research Associate, Scott Institute). My fellowship has been supervised by Rikk Mulligan (Digital Scholarship Strategist, University Libraries) and Anna Siefken (Executive Director, Wilton E. Scott Institute for Energy Innovation). My fellowship is made possible in partnership with the Council on Library and Information Resources (CLIR), with the generous support of the Alfred P. Sloan Foundation.
by Luling Huang, CLIR Postdoctoral Fellow in Data Curation for Energy Social Sciences
Feature image: screenshot from "An Introduction to Dimensions" video.
References with links (by order of appearance)
Wilton E. Scott Institute for Energy Innovation
Council on Library and Information Resources Postdoctoral Fellowship
Dimensions
Carnegie Mellon’s energy experts
Carnegie Mellon’s energy experts by topic area
IMPACT: Annual Report
Dimensions Analytics AP
Dimcli
The Dimensions Search Language
Concept score in Dimensions
Dash in Python
Plotly
Fields of Research
Dash DataTable